Company primarily operates in Tier-II and Tier-III cities, with a chain of “V2 Retail” stores offering apparel and general merchandise, catering to the entire family.
Q3 FY26 Earnings Results
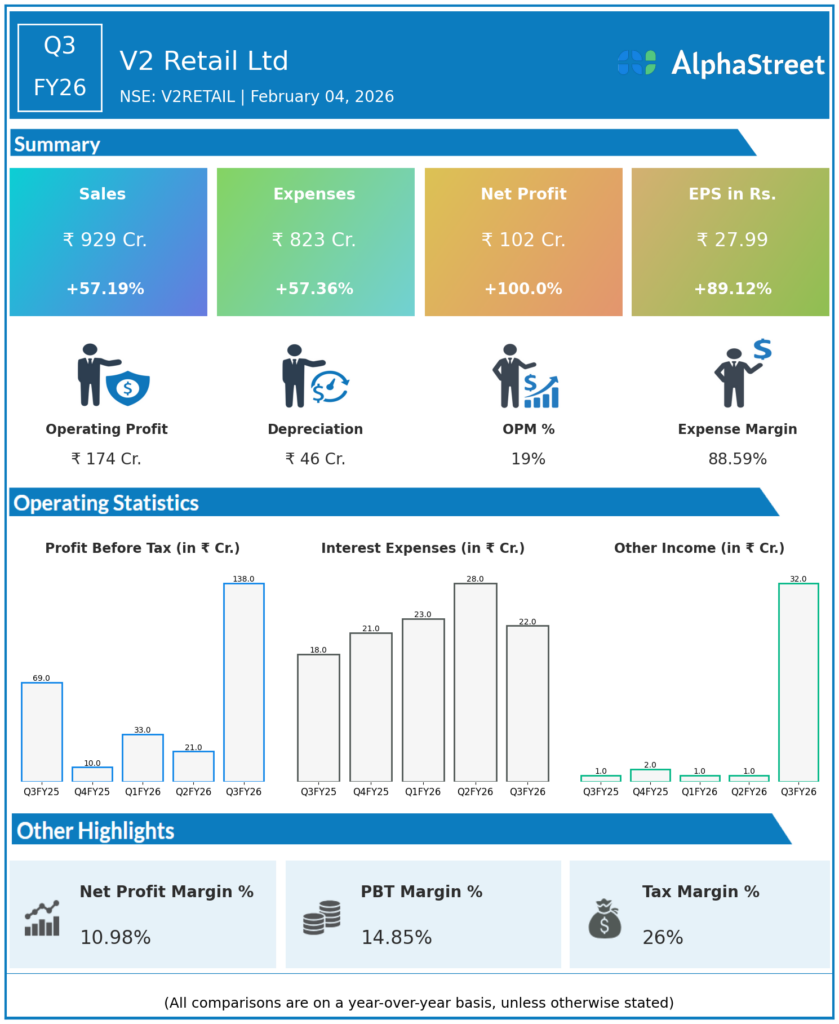
- Revenue from Operations: ₹929 cr, +57% YoY vs ₹592 cr in Q3 FY25, strong growth driven by aggressive store expansion and higher retail throughput.
- EBITDA: ₹174 cr, +56% YoY, EBITDA Margin 18.7% (improved operating efficiency).
- PAT: ₹102.06 cr, +99% YoY vs ₹51.19 cr in Q3 FY25; EPS: ₹29.17 (continuing strong profitability trend).
- Other key metrics:
• Same-Store Sales Growth (SSSG): 2% YoY reported; Normalized SSSG: 12.8% adjusted for festival shift effects.
• Store Count Expansion: Added 35 new stores in Q3, total network 294 stores (31.93 lakh sq ft footprint).
• 9M FY26 YTD: Revenue ₹2,270 cr, +64% YoY; EBITDA ₹347 cr +73% YoY; 9M PAT ₹144 cr +119% YoY, reflecting strong cumulative growth.
Management Commentary & Strategic Decisions
- Management highlighted robust revenue and profitability expansion through Q3, attributing growth to aggressive store additions, strong consumer demand across Tier 2/3 markets, and enhanced productivity per store.
- Retail footprint strategy: Continued network expansion remains a key driver, with ~294 stores nationwide and plans to deepen presence in underserved consumption corridors, reinforcing V2 Retail’s value-fashion leadership.
- Management commentary emphasized the importance of normalized same-store sales growth (12.8%) after adjusting for festival timing shifts, signaling healthy underlying demand beyond calendar effects.
- Operational focus: Improvement in gross and EBITDA margins (32.4% gross, 18.7% EBITDA in Q3) reflects efficient inventory management, higher full-price sales mix (92%), and disciplined cost control.
Q2 FY26 Earnings Results
- Revenue from Operations: ₹708.6 cr, +86% YoY vs ₹380 cr in Q2 FY25, significant top-line expansion.
- EBITDA: ₹85.4 cr, +158% YoY, EBITDA Margin 12.1%, improved operational leverage.
- PAT: ₹18.08 cr, vs loss in Q2 FY25, marking a strong turnaround; EPS uplift reflecting profitability recovery.
- Other key metrics: Same-Store Sales Growth (SSSG) 23.4% (reported) / 10.3% normalized (festival shift), store count: 259 stores by quarter end.
Management Commentary Q2
- Leadership noted a significant turnaround from prior-year losses, underscoring robust consumer demand and execution of expansion strategy across retail formats.
- Management emphasised store productivity, higher volumes and improved consumer engagement (evidenced by strong SSSG and average sales per sq ft), highlighting the value-driven model’s resonance.
- Operational pivot: Enhanced gross margins and a shift toward higher full-price sales (92% contribution) supported profitability despite aggressive scaling.
To view the company’s previous earnings and latest concall transcripts, click here to visit the Alphastreet India news channel.