Incorporated in 2007, RPG Life Sciences Ltd manufactures and markets Formulations (Finished Dosage Forms) and Active Pharma Ingredients.
Q3 FY26 Earnings Results
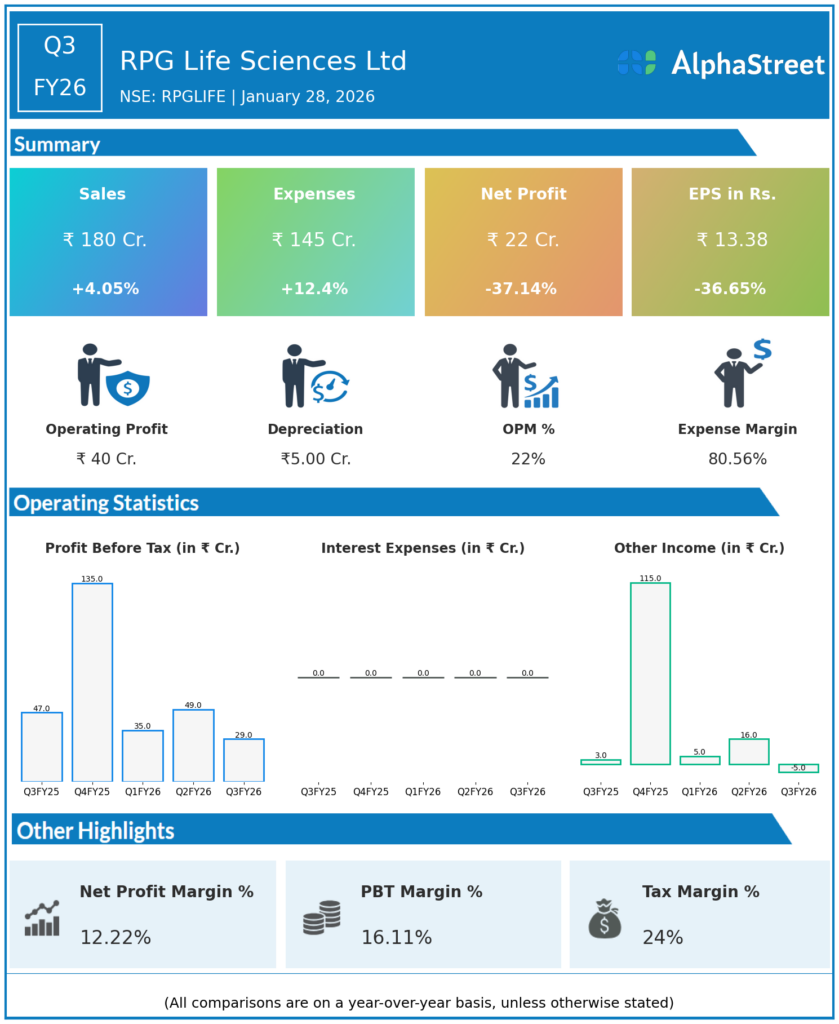
- Revenue from Operations: ₹180.03 cr, +4.24% YoY vs ₹172.71 cr, −0.91% QoQ vs ₹181.68 cr.
- EBITDA: ₹39.76 cr (PBDIT excl OI), +2% QoQ, margin 22.09% (+61 bps QoQ).
- PAT: ₹22.13 cr, −37% YoY vs ₹34.93 cr, −39.95% QoQ vs ₹36.85 cr, margin 12.29% (−799 bps QoQ).
- Other key metrics: Gross margin 19.16% (−1,093 bps QoQ); employee costs ₹35.32 cr (−2.3% QoQ); 9M revenue ₹530.6 cr.
Management Commentary & Strategic Decisions
- Revenue stability amid flat trajectory; sharp margin erosion from gross profit pressure signals pricing/raw material challenges.
- Strategic moves: Board approved Q3/9M unaudited results; focus on operational relief via cost cuts but profitability sustainability questioned.
Q2 FY26 Earnings Results
- Revenue from Operations: ₹181.7 cr, +5.5% YoY vs ₹172.2 cr, +7.6% QoQ vs ₹168.9 cr.
- EBITDA: ₹43.6 cr, −9% YoY vs ₹47.9 cr, +7.1% QoQ, margin 24% (−380 bps YoY).
- PAT: ₹36.85 cr, +777% YoY vs ₹4.2 cr (boosted by exceptional income), +8.4% QoQ, EPS ₹22.28.
- Other key metrics: Domestic formulations 71% revenue (+13.5% H1 YoY); intl formulations +2.1% YoY; H1 revenue ₹350.6 cr.
Management Commentary Q2
- Domestic formulations drove growth outperforming market; EBITDA dip from R&D/promotional spends despite topline gains.
- Strategic moves: CFO resignation noted; emphasis on mega brands, ESG, global expansion; insurance proceeds aided PAT surge.
To view the company’s previous earnings and latest concall transcripts, click here to visit the Alphastreet India news channel.