Polycab is India’s leading manufacturers of cables and wires and allied products such as uPVC conduits and lugs and glands. We have a range of cables and wires for practically every application. More recently Polycab has also launched a wide range of consumer electrical products like Fans, Switches, Switchgear, LED lights and Luminaries, Solar Inverters, and Pumps.
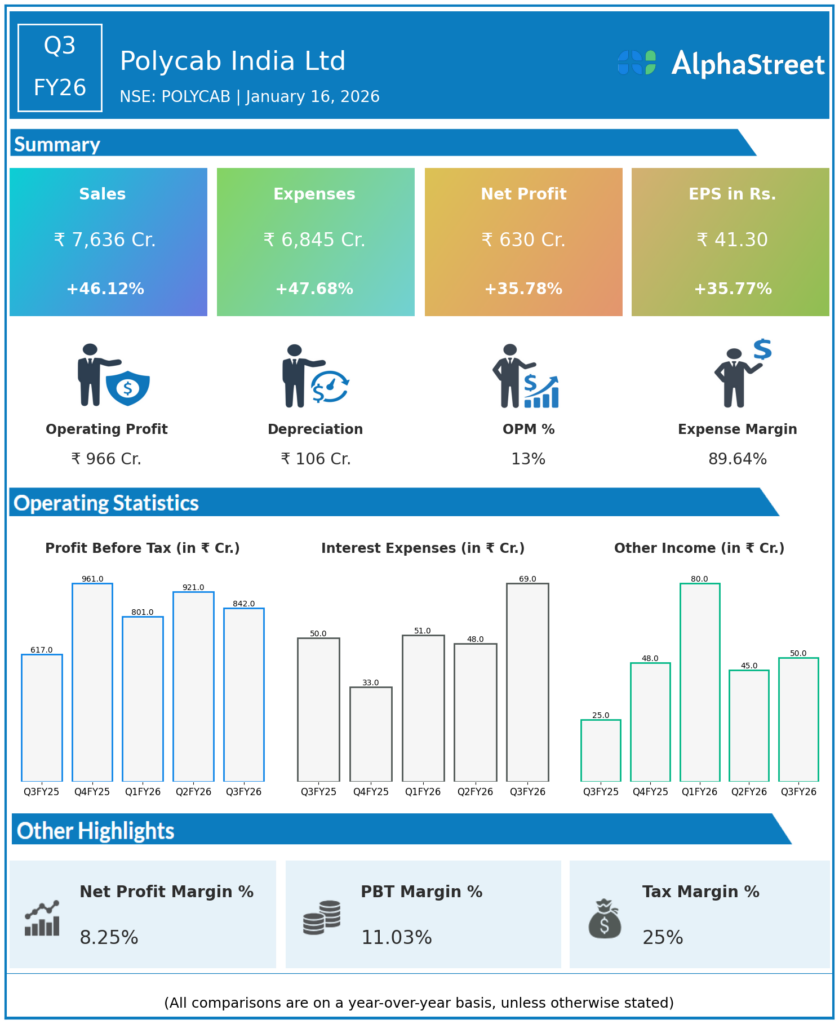
Q3 FY26 Earnings Results
- Revenue from Operations: ₹76,361 million, up 46% YoY from ₹52,261 million; up 18% QoQ from ₹64,772 million in Q2 FY26.
- EBITDA: ₹9,661 million, up 34% YoY from ~₹7,210 million; EBITDA margin 12.7% vs 13.8% in Q3 FY25 and ~15.8% in Q2 FY26, indicating margin compression despite strong growth.
- Profit After Tax (PAT): ₹6,302 million, up 35–36% YoY from ₹4,643 million; PAT margin ~8.3% vs ~8.9% in Q3 FY25.
- Nine‑month (9M FY26) performance:
- Revenue: ₹2,00,193 million, up ~30% YoY from ₹1,54,225 million.
- EBITDA: ₹28,444 million, up ~47% YoY from ₹19,349 million.
- PAT: ₹19,228 million, up ~47% YoY from ₹13,112 million; 9M EBITDA margin 14.2%, PAT margin 9.6%.
- Segment performance – Q3 FY26:
- Wires & Cables: Revenue up ~53% YoY; continues to be the primary growth driver and largest contributor to sales.cms.
- FMEG (Fast‑Moving Electrical Goods): Revenue up ~17% YoY, maintaining healthy double‑digit growth.
- EPC: Revenues softer YoY, but EBIT improved due to mix and one‑off gains in earlier quarter (base effect).
Management Commentary & Strategic Decisions
- Management highlighted Q3 FY26 as a record quarter across revenue, EBITDA and PAT, driven by robust demand in both domestic distribution and institutional businesses within wires & cables, and continued scale‑up in FMEG.
- Margin compression QoQ and YoY at EBITDA level was attributed mainly to higher raw‑material costs, elevated advertising and sales‑promotion spends (ad spends up sharply to about ₹9.1 billion from ~₹3.7 billion YoY), and increased logistics and finance costs as the business scaled.
- Strategic focus areas reiterated:
- Sustained investment in brand building and distribution expansion, especially for FMEG and retail wires, to strengthen long‑term franchise despite near‑term margin impact.
- Continued emphasis on premiumisation, channel depth and export growth in the Wires & Cables business.cms.
- Tight working‑capital management and cost optimisation to support profitability as scale increases.
- Governance & leadership: Board actions included re‑appointment of Manju Agarwal as Independent Director and redesignation of key Executive Directors as Joint Managing Directors, signaling continuity and strengthening of top management.
Q2 FY26 Earnings Results
- Revenue from Operations: ₹64,772 million, up 18% YoY from ₹54,847 million in Q2 FY25; then grew a further 18% QoQ into Q3 FY26.
- EBITDA: ₹10,207 million, up 62% YoY; EBITDA margin ~15.8% vs ~11.7% in Q2 FY25 and ~14.2% in Q1 FY26.
- Profit After Tax (PAT): ₹6,930 million, up 56% YoY; highest‑ever quarterly PAT at that time.
- H1 FY26 highlights:
- Revenue: >₹1,20,000 million, up 21% YoY.
- Wires & Cables: H1 revenue ₹1,07,641 million, up 26% YoY.
- FMEG: H1 revenue ₹8,897 million, up 16% YoY.
- EPC: H1 revenue down 19% YoY, though EBIT grew 11–42% YoY supported by mix and one‑off gains.
Management Commentary & Strategic Directions
- Management described Q2 FY26 as the “highest ever second quarter and half‑year” for revenue and profitability, with wires & cables margins particularly strong and aided by favourable commodity trends and mix.
- EBITDA growth of 62% YoY was driven by operating leverage, better product mix, and a one‑off benefit in the EPC segment, even after higher marketing spends.
- Strategic themes:
- Deepening distribution reach in Tier‑2/3 markets and expanding the product portfolio in fans, lighting and other FMEG categories.
- Scaling the international business (around 6% of revenues) with focus on select high‑potential geographies.
- Maintaining a structurally strong balance sheet while investing in capacity, brand and technology to support the next leg of growth.
To view the company’s previous earnings and latest concall transcripts, click here to visit the Alphastreet India news channel.