
Orient Bell Limited (NSE: ORIENTBELL/BSE: 530365), a prominent player in the Indian ceramic and vitrified tiles industry, has announced its unaudited financial results for the quarter and nine months ended December 31, 2025.
A comparison of OBL’s financial results for the third quarter (Q3) against the cumulative nine-month period ending December 31, 2025, reveals that the third quarter was a primary driver of the company’s annual profitability and margin expansion.
Revenue Contribution & Stability
The revenue generated in Q3 represents a significant and stable portion of the total nine-month income.
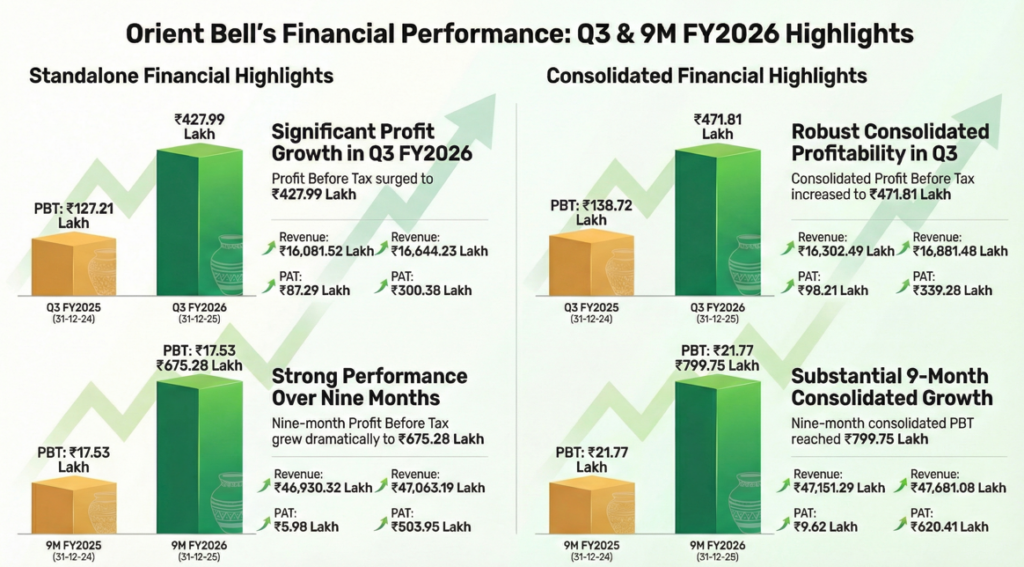
- Standalone Revenue: Q3 revenue from operations stood at ₹16,644.23 lakh, contributing approximately 35.4% of the total nine-month revenue of ₹47,063.19 lakh.
- Consolidated Revenue: On a consolidated basis, Q3 revenue was ₹16,881.48 lakh, accounting for 35.4% of the nine-month total of ₹47,681.08 lakh.
- Total Income: The standalone total income for Q3 was ₹16,694.80 lakh, compared to the nine-month cumulative total of ₹47,226.58 lakh. This distribution suggests a consistent demand for “Ceramic Tiles and Allied Products” throughout the fiscal year, with Q3 performing slightly above a standard quarterly average (25%).
Profitability Concentration in Q3
The most notable trend is the high concentration of the nine-month profit occurring within the third quarter alone.
- Profit Before Tax (PBT): Standalone PBT for Q3 was ₹427.99 lakh, which accounts for 63.4% of the total nine-month PBT of ₹675.28 lakh.
- Net Profit (PAT): Standalone net profit for Q3 reached ₹300.38 lakh, representing nearly 60% of the ₹503.95 lakh earned over the entire nine-month period.
- Consolidated Impact: In consolidated terms, the Q3 profit of ₹339.28 lakh comprised 54.7% of the nine-month profit of ₹620.41 lakh. This indicates that OBL significantly optimized its margins or experienced a more favorable product mix during the third quarter compared to the first two quarters of the fiscal year.
Earnings & Associate Performance
The earnings per share (EPS) also reflect this Q3-weighted performance. The standalone Basic EPS for Q3 was ₹2.05, more than half of the nine-month cumulative EPS of ₹3.43. On a consolidated basis, the Q3 EPS was ₹2.31 against a nine-month total of ₹4.23.
Furthermore, the contribution from associate companies followed a similar trend. The Group’s share of profit from associates in Q3 was ₹24.82 lakh, which is 26.5% of the nine-month share of ₹93.79 lakh.
The wholly owned subsidiary, Cestrum Enterprises Private Limited, contributed ₹14.08 lakh to the consolidated profit in Q3, making up 61.9% of its nine-month contribution of ₹22.73 lakh.
Expense Comparison
While revenues were steady, certain costs were managed more tightly in Q3 relative to the yearly average.
- Finance Costs: Q3 standalone finance costs were ₹94.11 lakh, approximately 31.9% of the nine-month total of ₹295.10 lakh.
- Power & Fuel: Q3 standalone charges were ₹3,079.98 lakh, representing 32% of the nine-month total of ₹9,599.67 lakh.
Summary
Sources indicate that while revenue was distributed relatively evenly throughout the year, the third quarter of FY26 was disproportionately responsible for the company’s overall profitability and earnings growth for the nine-month period.